In February 2013, Seattle-resident and open government consultant Sarah Schacht caught E. coli for the second time in her life after eating at a “mom-and-pop” restaurant, now-defunct Ambassel Ethiopian Cuisine & Bar. She survived what she describes as a near-death experience without losing any organs and with no permanent brain damage—two of the potential effects of the bacterial infection. Still, it wasn’t pretty.
“If anybody has watched Games of Thrones and jumps to its death scenes, that’s what E. coli feels like,” Schacht says. “You’re being repeatedly stubbed in the guts.”
She says that she had no idea that Ambassel Ethiopian had a long string of food-safety violations—despite Public Health King County/Seattle having a trove of troubling information on health inspections at area restaurants—because it was difficult to obtain this info back in 2013.
After recovering from the E. coli, Schacht asked Public Health to make its food safety scores available for the public and redesign its website to make it more user-friendly. She asked, and asked, and asked again. All that she received, she says, was a lack of response, indifference and, at some point, notifications from risk management lawyers.
She continued with her food safety crusade later in 2014 by authoring a petition that asked King County to post restaurant inspection records. The petition received more than 2,000 signatures, and Public Health finally agreed to begin a process to post signs with inspection scores.
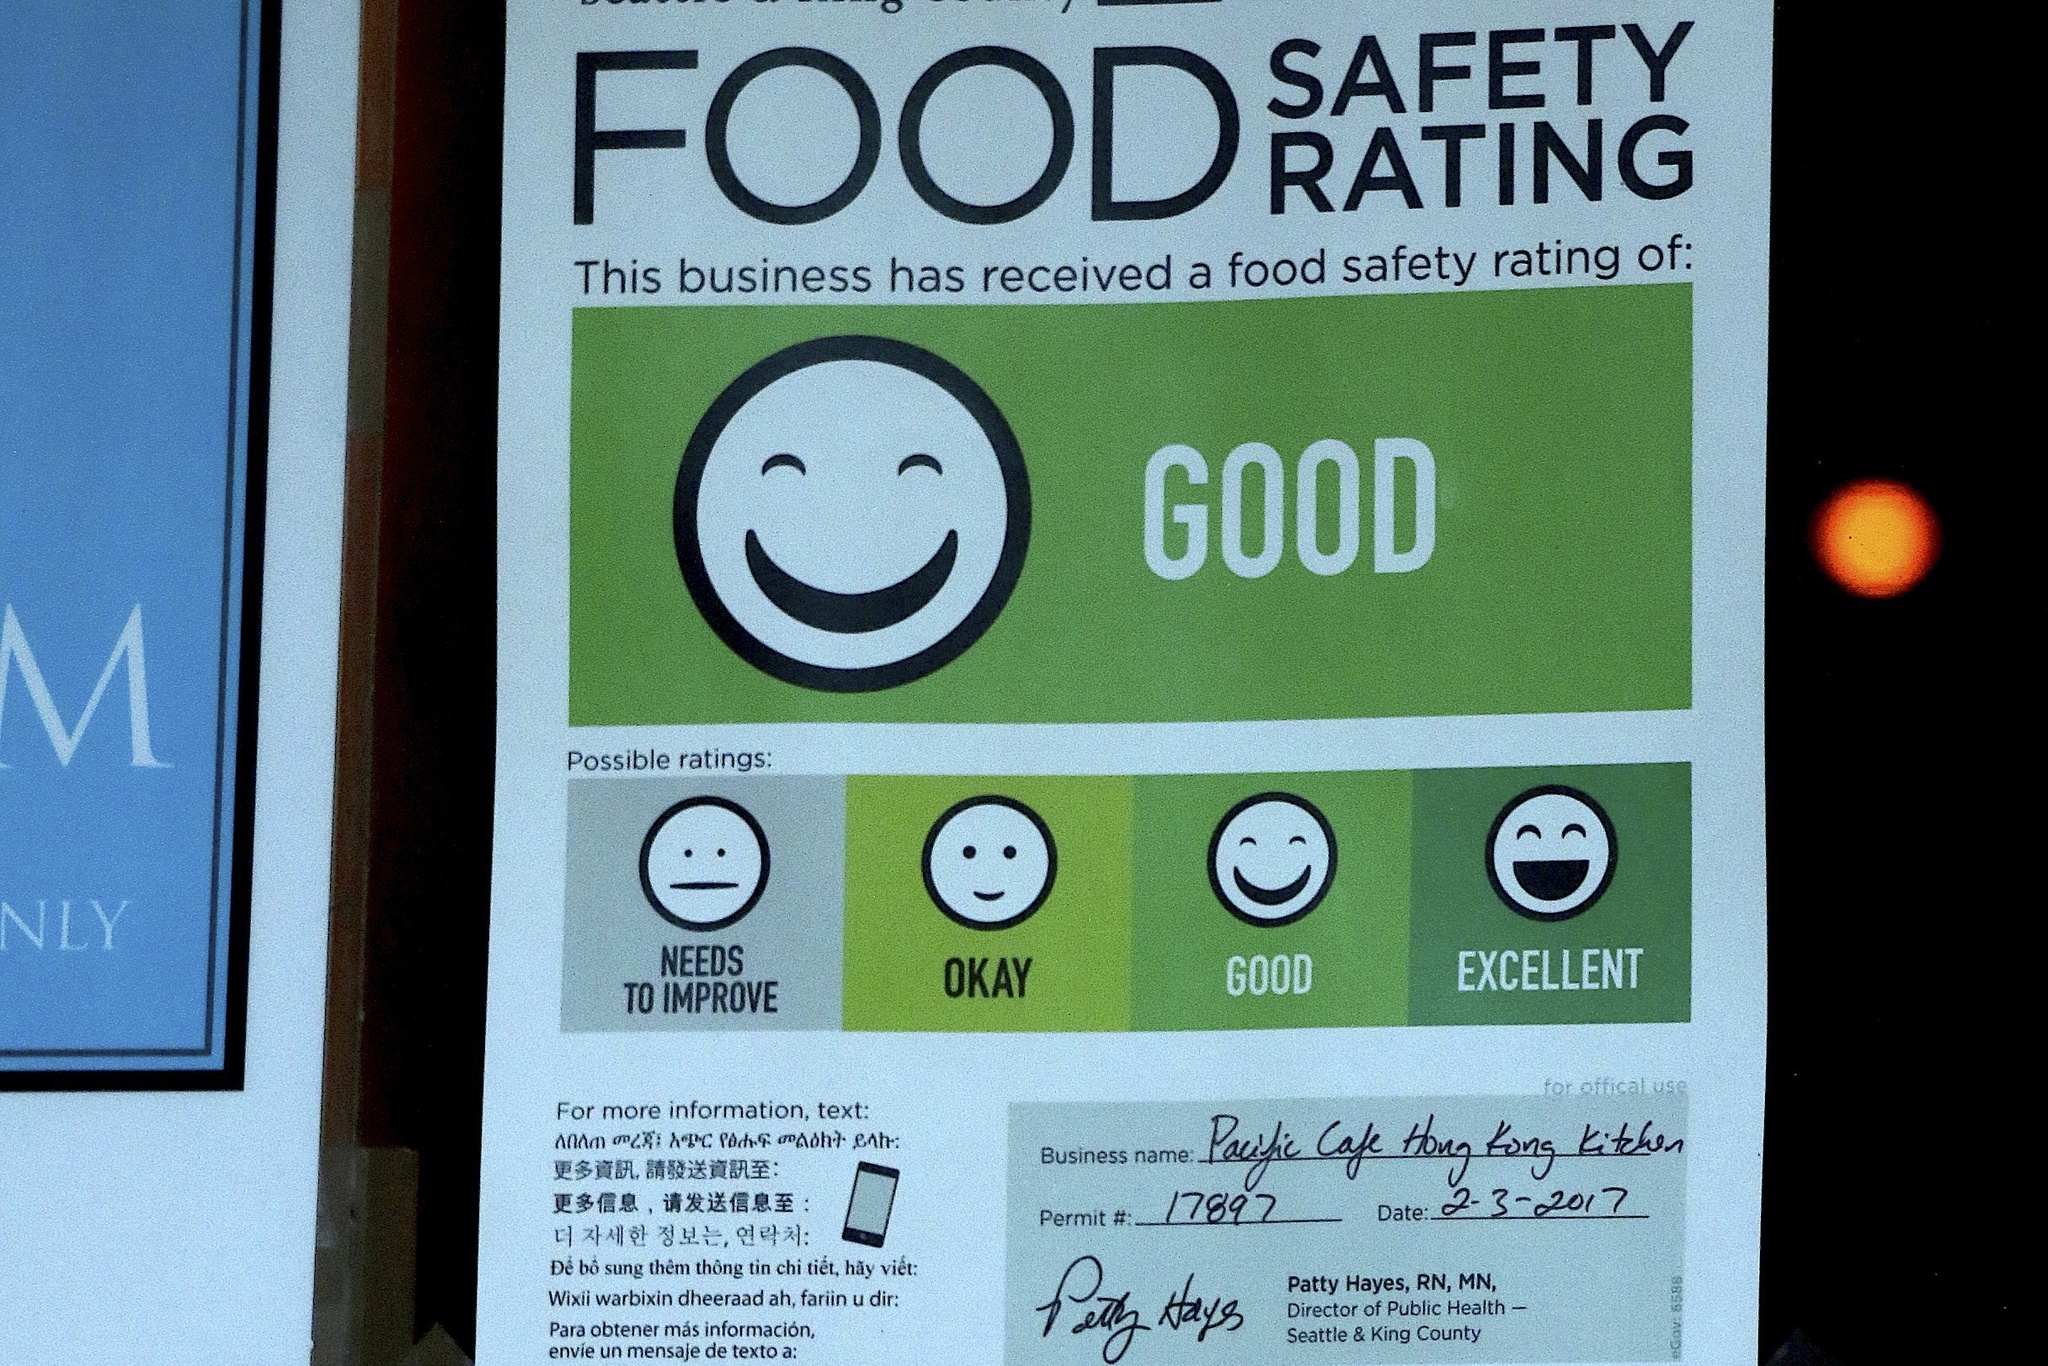
The result is the current emoji-based window-sign system that the county rolled out Jan. 17, when Elliott Bay Brewery in Lake City became the first food venue in the county where a food safety system sign was placed. You’ve probably seen them by now, little cartoon drawing with smiles commensurate with how clean the restaurant is.
But for Schacht, what should have been a cause for celebration has become just another round of frustration. She’s not smiling at these emojis at all.
Schacht, arguably the most active critic of the food safety rating system, says that her main concern is that the system is based on zip codes—that is, restaurants are graded on a curve based on how well restaurants in their proximity did. This format, she believes, creates an artificial distribution of areas that will obscure data from entire neighborhoods where food safety is a critical issue.
“The problem is that vulnerable populations like cancer patients, pregnant women, small children, elderly, will not know that perhaps they’re eating in a riskier neighborhood,” Schacht says. “That’s really unfair to consumers and it undermines what the placards are supposed to be about.”
But Public Health’s food program manager Becky Elias believes the curve system is effective.
Elias argues that the zip-code format helps mitigate inevitable style difference that occur between different inspectors—i.e., strict inspectors vs. lenient ones—since the health department tends to assign its inspectors based on a zip code area.
Elias says that she understands that the novelty of the process can be hard to grasp at the beginning but hopes it will be a system that works for both restaurants and consumers.
“I agree that there’s complicated information behind what informs the sign, but we actually consider that that’s what the public asked us to do,” Elias says. “We believe that rating with the zip code adjustment is most effective at capturing the many factors that influence food safety inspection results and then summarizing the information based on relative food safety performance.”
Different Hoods, Different Grades
To better understand how the curve does and doesn’t work, consider two restaurants in Northeast Seattle—Elliott Bay Brewery and one of its neighbors, the Jack in the Box located on Northeast 133rd Street and Lake City Way Northeast.
The brewery has committed only three red critical violations—those violations considered to put patrons at serious health risk—in the last four routine inspections, averaging 3.75 points in red critical violations since September 2015. It has received an “Excellent” grade from the health department.
By contrast, the fast-food restaurant in Lake City averages 20 points for red critical violations since October 2015.
In the 98125 zip code—where Elliott Bay Brewery and this Jack in the Box branch are located—the average scores of all the restaurants have created a “point cutoff” for the “Excellent” category of 7.5 points while the limit between the “Good” and “Okay” categories is 32.5 points. Clearly, with its 3.75 points, Elliott Bay Brewery fits in the first section and the Jack in the Box located in Lake City, with its 20 points, should be rated as “Good” but not “Okay.”
Were these restaurants elsewhere in the county, they would have different emojis in their window. For example, an “Excellent” restaurant in the 98055 area in Renton needs an average of zero points, meaning Elliott Bay Brewing’s extremely low 3.75 points would still not earn an “Excellent” rating. Meanwhile, the Jack in the Box would get downgraded to “Okay,” since the cut off for “good” in that neighborhood is 18.75. The variation is wide: the “Excellent” category in the 98122 area (the Central District) corresponds to venues with an average of or below 8.75 points. The 98004 and 98009 areas in Bellevue or the 98073 in Redmond have an average of 12.5 for the top category, the highest number in the county.
Arbitrary as this sounds, there is ample evidence that the inspectors who provide the raw health grade data play a large role in how restaurants score. That means that there’s a chance that were Elliott Bay located in that Renton zip code, the inspector there would not find any “red critical” problems, meaning it would score a zero and keep its “excellent” rating. Hence the curve.
Right to Know
Along with criticism of the curve, Schacht is also concerned with the way the county announced its plan.
Elias says Public Health did research throughout 2015 to come up with this system, basing its final model mostly on the recommendations of a stakeholder subcommittee that the office had created a year before.
Schacht was invited to participate in this stakeholder committee because of her previous professional work in diverse organizations and despite the fact that she had no association with any restaurant.
The county shared this work in progress on inspection consistency and zip code adjustments in public meetings and at Board of Health meetings in 2014.
Elias says that the information about zip codes and the grading curve was posted on Facebook and Twitter, on Public Health Insider—the institution’s blog—and newsletters for restaurant owners and registered costumers as well.
However, this was not explicitly available on the Public Health’s blog until very recently. In fact, the very first explicit reference of the curve system on Public Health Insider was included in a post dating from Dec. 19, only one month before the first window sign was posted at Elliott Bay Brewery.
Members of the Seattle Restaurant Alliance were part of the stakeholder committee and have collaborated actively with the creation and development of the food safety rating system since 2014.
Jillian Henze, the local communication manager of the alliance, says that, although the rating system was part of the cooperation with Public Health, she didn’t have a full picture of the curve system and the zip code area adjustment until Jan. 17, when the first emoji sign was posted and the whole system was rolled out.
Henze says that the alliance is OK with that lack of knowledge and just wants to roll with the rating system.
“We have the new system now and we’re actually looking forward to work with the new system and getting any feedback to Becky [Elias] and her team,” Henze says. “We’re really happy and have confidence in their decisions.”
“As a program, we care so much about food and its role and place in our community and we really value having people being empowered by food,” Elias says.“We want people to feel confident about how they are making food and that they are doing it safely and we want people to feel confident about that they are eating.”
Despite her tough criticism with the food safety system, Schacht agrees that it has a few positive aspects, especially the fact that the scores represent the average of the four most recent restaurant inspections.
But with the system now officially rolled out and the window signs popping up all over King County, Schacht says that, above all, only a countywide system, and not a neighborhood-based one, could be fair and equal.
The Northeast Seattle resident also says that Public Health can keep the placards but she wishes they will show the actual food safety score or at least each of the grading ranges and where the restaurant fits in that range. Finally, she would like the system to consider grading food trucks and delivery services in the future. These services are not taken in consideration right now because of the zip code format.
“An emoji isn’t data, so Public Health needs to get this data out so consumers can see the food safety scores online but also when they are at the restaurant,” Schacht says. “When you make an order from a menu and when you’re looking at a restaurant on an app quickly before grabbing lunch, you should be able to see a restaurant inspection score.”
jhidalgo@seattleweekly.com


